Matlab User Quick Start
(Windows, Mac OS X,
Note on calibration)
Matlab users with Windows:
- Download the
SensorStick
driver

- Connect the SenorStick to your
computer with the supplied USB cable
and install the SensorStick driver
xp user: click
here
for instruction
Vista/Win7 user: right click "computer",
select "property", then click "Device Manager". You will see "sensorstick"
shown in the unknown device area with a "!" mark. Right click
that and choose "Update Driver Software...". Choose
"Browse my computer for driver software". Locate the folder
where you saved the driver. Then Windows will popup a window
saying "Windows can't verify the publisher of this driver
software". Make sure you choose "Install the driver software
anyway". Wait a while, windows will tell you the driver is
installed successfully.
- Download the Matlab
general control program and unzip it. By default, a folder named
generalControl is created and all the scripts are in this folder.
- Find the COM port number and run the program:
Run "multimeter.m" or
"sensorstickV1.m" in the
generalControl folder. The program will detect the available COM ports.
In case multiple COM ports are available,
you can try each one till one of them works. (Don't worry, there is usually
no more than two ports available)
|
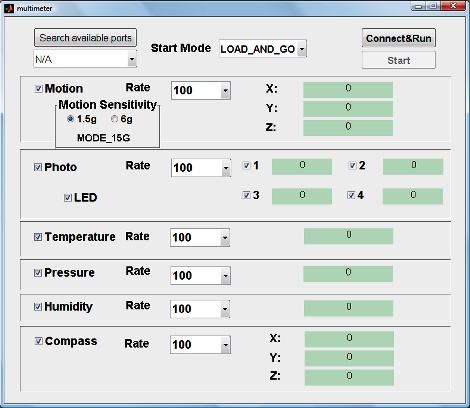
This
multimeter mode
GUI
offers full control of our SensorStick. All six
types of sensors can be turned on/off and the sampling rate can be adjusted.
It can
also
search the COM ports available. Users may find this mode most convenient
while recording data from experiments.
|
 |
|
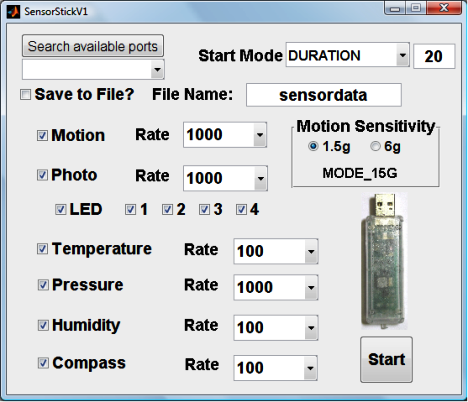
This GUI will launch a time series display shown below. Users
can choose whether or not to save the data
into a file. Again, all six
types of sensors can be turned on/off and the sampling rate can be adjusted.
Users may find this mode most convenient while performing demonstration or
confirming qualitative behavior. |
 |
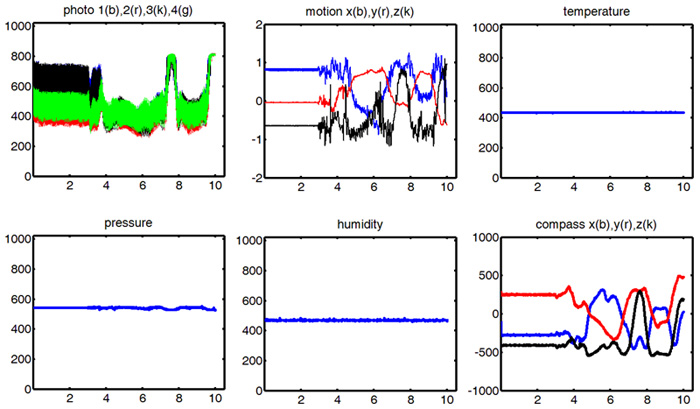
- Click "Start" in the above GUI (it will call the function defined in
controlfunction.m), the following data plots will be shown on the screen. These are real time sensor data. If data is saved in a file, users can analyze data offline as well.
Matlab users with Mac:
Skip the first two steps above. You don't need to install any
driver. The SensorStick will be recognized as a modem. To find the
port name, open a terminal (type terminal in Spotlight, click
"Terminal"), then type "ls -a /dev/tty.*" in the command line.
Compare the difference with and without the SensorStick pluged in.
The difference is the port name. It might look sth like:
/dev/tty.usbmodem411. Again, the Matlab itself doesn't work
as rebust on Mac as well. You have to click the disconnect or close
the program before unplug the SensorStick. Otherwise, the Matlab
will crash.
Notes Note that there is a text file "calib.txt".
This file contains calibration information for accelerometer and magnetic compass. All
the other sensor outputs are raw 10 bit digital
values. Users can calibrate all the sensors
themselves. For suggested calibration values, please
refer to the Excel file "calib.xls".
The format of the file "calib.txt" is as follows:
The first line is the offset of accelerometer in three directions (x y z in sequence): meaning the output value representing true zero.
The second line is the scale needed to adjust the output to units of
acceleration owe to gravity, g
The third line is the offset for magnetic compass
The fourth line is the the scale to adjust the compass output
Users can measure these calibration values
themselves. The default input file is as follows
0 0 0
1 1 1
0 0 0
1 1 1
In this case, the file values result in no calibration and the
output is the raw sensor digital data.
Or, you can use the calibration values in the Excel file calib.xls. Refer to the serial number on the
SensorStick to look up the appropriate values.
If you decide to use the calibration data, the
default display range (0~1024) may need to be
adjusted to show the
calibrated data. For example, the value given in the calib.xls
will calibrate acceleration data to vary from about
-2 to 2 with unit g (gravity). So you should adjust
the min/max value of y axis accordingly.
|