Quick Start
(Windows, Mac OS X,
Note on calibration,
Matlab)
Mac users using standalone program:
-
You don't need to install any driver. The SensorStick will be recognized as a modem. Download the
Mac Standalone Control Program. Unzip it, a
program called "SensorStickMac" should be created. It is located
now at Download folder. You can move it anywhere else at your
convenience. Before you can run the program, you need to install
mono and
X11. 
-
Now you can double click the "SensorStickMac.command"
in Finder. The rest is the same. Notice the this release on Mac is
not as stable as it is on Windows. If some error occur, just close
it and unplug
the SensorStick. Then double click the "SensorStickMac.command"
to start over .
This GUI
offers full control of our SensorStick. A list of
available
COM ports will be
given in the dropdown list. When the right one is chosen, a
"device connected" message will be shown at the bottom. All six
types of sensors can be turned on/off and the sampling rate can be adjusted.
Two modes are available:
* Multimeter: time averaged data will
shown directly in the box on the GUI.
Users may find this mode most convenient while recording
data from experiments.
* Time series: a new window will pop up exhibitng sensor
data versus time plots. Users may find this mode most useful
when only qualitative behavior is required (like
demonstration) . |
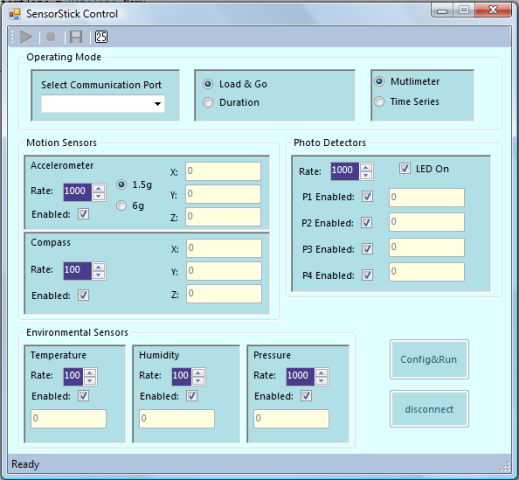 |
- After the correct communication port is selected.
Control buttons will be enabled. Click "Config&Run",
the sensorstick will start collect data which will be displayed depending on
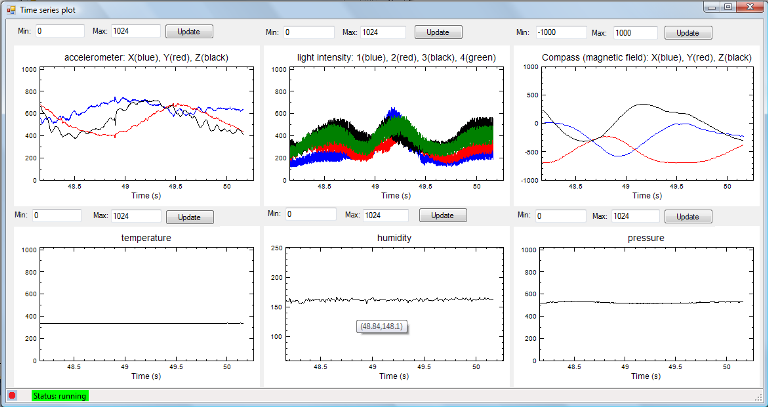
the chosen mode. If time series mode is chosen, the following data
plots will be shown on the screen. These are real time sensor data.
Users can interact with these plot intuitively. For example, if users
drag a mouse on each axis, it behaves as a zoom
in/out. The plot region can also be dragged to move
up/down/left/right. Further, you can manually set
the min/max value of each y axis.
If users want to save data in a file, click the "save" button before clicking the "Config&Run" button. In "Duration" mode, the file will be closed automatically after the preset time runs out. In "Load&Go" mode, however, users could close the file manually if they decide to stop saving.
Notes Note that there is a text file "calib.txt".
This file contains calibration information for accelerometer and magnetic compass. All
the other sensor outputs are raw 10 bit digital
values. Users can calibrate all the sensors
themselves. For suggested calibration values, please
refer to the Excel file "calib.xls".
The format of the file "calib.txt" is as follows:
The first line is the offset of accelerometer in three directions (x y z in sequence): meaning the output value representing true zero.
The second line is the scale needed to adjust the output to units of
acceleration owe to gravity, g
The third line is the offset for magnetic compass
The fourth line is the the scale to adjust the compass output
Users can measure these calibration values
themselves. The default input file is as follows
0 0 0
1 1 1
0 0 0
1 1 1
In this case, the file values result in no calibration and the
output is the raw sensor digital data.
Or, you can use the calibration values in the Excel file calib.xls. Refer to the serial number on the
SensorStick to look up the appropriate values.
If you decide to use the calibration data, the
default display range (0~1024) may need to be
adjusted to show the
calibrated data. For example, the value given in the calib.xls
will calibrate acceleration data to vary from about
-2 to 2 with unit g (gravity). So you should adjust
the min/max value of y axis accordingly.
|
|